- All Students must log in to STAR via Clever by clicking on Renaissance Learning. You can also log in to your account this way.
- A demo video (about 2 minutes) and practice test questions (about ten questions) have been enabled for this first test.
- The STAR assessments have been locked to only be accessible from 8 am to 4:30 pm.
- No calculators are allowed; however, a student can use scratch paper for both Math and Reading tests.
- Cover or remove any materials on the walls, whiteboard, and other areas that might help students answer test items.
- A reminder that all the questions are timed. Math Time limits - Reading Time Limit - Early Literacy Time Limit
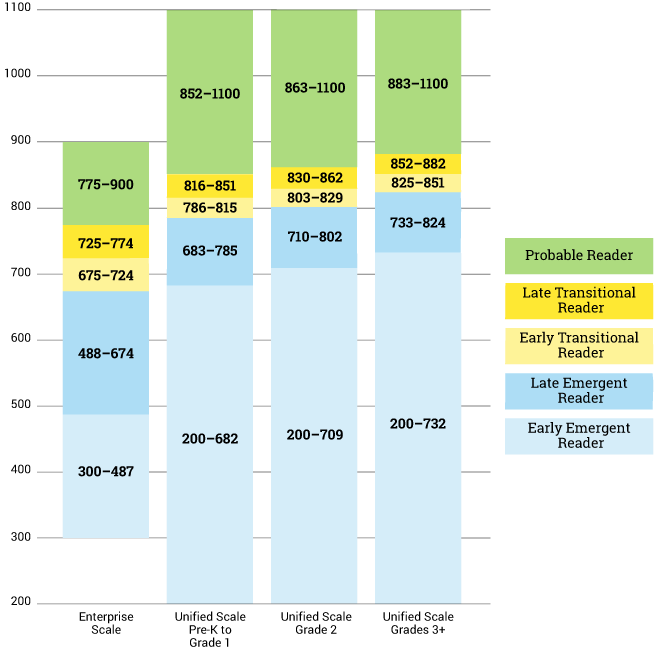
- Click here to view the unified scale and how Literacy is classified.
- If any of your students have documented medical reasons for which they must be provided additional time, please let me know so I can provide the required accommodations for that student's test.
- Test Manual Please READ - STAR Math | STAR Reading | STAR Early Literacy
- MONITOR PASSWORD: SJS
- You have the option of administering the test. I would suggest administering the Benchmark and the End of Trimester test to provide a year snapshot for your student's abilities.
- Your students must take the Early Literacy Assessment first. Should they score at least a performance score (SS) of 775, they should also take the STAR Math or STAR Reading assessments. Per Renaissance Learning and the Diocese, students must show proficiency in necessary skills BEFORE taking the Math and Reading assessments.
- The Early Literacy assessment takes fewer than 15 minutes.
- 1st Grade is required to take Reading & Math tests during the End of Trimester 3 window.
- A Reading and math assessment should take about 20 - 30 minutes unless STAR determines that they are At/Above Benchmark. After a student finishes, please check that they took a reliable test by viewing the student's Test Duration & Fidelity time found in the STAR Diagnostic Report, which is available within five minutes of a completed test.
- No calculators are allowed; however, a student can use scratch paper for both Math and Reading tests.
For example, if a 5th-grade student has a GE of 7.6, their score is equal to that of a typical 7th grader after the sixth month of the school year. This score does not necessarily mean that they are capable of doing class work at the 7th-grade level. It only indicates that their skills are well above average for their grade level.
A GE score preceded by a "greater than" sign (>) is a capped score. GE scores in excess of three grade levels above the student's actual grade are capped, meaning that such GE scores are shown as "> [student's actual grade level + 3]." This prevents the misinterpretation that students with excessively high GE scores are capable of work at those higher grades.
Percentile Rank scores range from 1 to 99 and express student ability relative to the scores of other students in the same grade. For a particular student, this score indicates the percentage of students in the norms group who obtained lower scores. For example, if a reading assessment gave a student a Percentile Rank of 85, the student's reading skills are greater than 85% of other children in the same grade.
The Percentile Rank Range reflects the amount of statistical uncertainty in a student's Percentile Rank score. If the student were tested multiple times or finished a number of assessments in a short period of time, the score would likely fall in this range.
Unified Scaled Literacy Classification*
Was this article helpful?
That’s Great!
Thank you for your feedback
Sorry! We couldn't be helpful
Thank you for your feedback
Feedback sent
We appreciate your effort and will try to fix the article